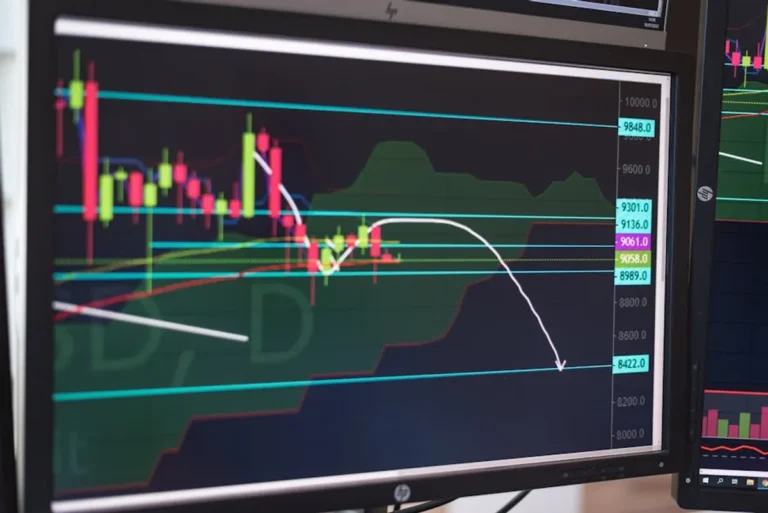


Search volatility dashboards solve a specific problem: they tell you whether a ranking drop is likely your fault, a sitewide technical issue, a competitor move, or a broader Google shake-up hitting an entire market. That distinction matters because the response is different. If search weather is calm, you investigate pages, links, templates, cannibalization, and crawl behavior. If search weather is spiking across sectors, you stop overreacting to one-day swings and start looking for update patterns, affected query classes, and whether the turbulence is isolated to mobile, local, product, news, or informational results. This allows you to better distinguish between true SERP volatility versus daily fluctuations and react appropriately.
Not all dashboards answer that question equally well. Some are built around broad market temperature scores. Others are useful because they expose category-level movement, local pack shifts, feature churn, or daily visibility changes across tracked keywords. Some are free but shallow. Others are expensive, but they let agencies explain ranking swings to clients with evidence instead of guesswork. The right choice depends on whether you need macro search weather, your own portfolio’s instability, competitor movement, or a blend of all three. Understanding these different levels helps you determine when volatility is a warning sign or just normal market noise.
What to Look For
Look first at sampling logic. A volatility score is only useful if you understand what is being measured: desktop or mobile, country coverage, keyword basket size, refresh rate, and whether the data reflects all industries or a filtered segment. A dashboard that mixes query classes without clear segmentation can hide the exact pattern you need to spot.
Second, check whether the product separates broad SERP turbulence from your own tracked rankings. Those are different jobs. Public weather tools help you interpret market conditions. Rank monitoring platforms with visibility and share-of-voice layers help you quantify whether your own losses are abnormal relative to the market. The most commercially useful setups combine both.
Third, pay attention to SERP feature visibility. A rankings swing caused by local packs, AI overviews, shopping units, video blocks, or featured snippets is not the same as a classic blue-link reshuffle. If the dashboard does not show feature movement, you can misread volatility as a pure organic ranking issue.
Finally, think about reporting. Agencies and in-house teams need charts that explain timing, category impact, and recovery windows. The best dashboards make it easy to answer three questions fast: when did instability begin, which query groups were hit hardest, and did the market normalize or keep cascading over several days?
1. Semrush Sensor
Semrush Sensor is the most useful all-purpose search weather dashboard for teams that need a fast read on whether Google is behaving unusually across markets. Its value is not just the headline volatility score. It breaks movement down by device, country, and vertical, and it tracks SERP feature turbulence separately enough to help you spot whether the instability is tied to layout changes rather than standard rank reshuffling.
Best for: Agencies, enterprise SEO teams, and publishers that need a daily external benchmark to contextualize ranking swings across multiple sectors.
Pros: Broad country coverage; industry segmentation; mobile and desktop views; historical trend visibility; useful SERP feature tracking; easy to cite in client reporting when traffic dips line up with wider market movement.
Cons: It is still a market-level indicator, not proof of impact on your own keyword set; some sectors can look calmer or hotter than your niche if your query mix is unusual; the top-line score is easy for non-SEOs to overinterpret without context.
Verdict: If you need one public-facing weather index to check before escalating a ranking drop, this is usually the first stop because it gives enough segmentation to separate broad turbulence from isolated site issues.
2. MozCast
MozCast remains one of the cleanest volatility references because it keeps the concept simple: a weather-style temperature signal for Google SERP movement. That simplicity is exactly why many SEOs still use it. When the “temperature” spikes, it gives you a fast sanity check before you start rewriting pages or blaming a deployment.
Best for: SEO professionals who want a quick market pulse without digging through a heavy interface.
Pros: Easy to read at a glance; long-standing industry familiarity; useful for historical comparisons when discussing prior update periods; low-friction way to validate whether chatter about turbulence has a measurable basis.
Cons: Less granular than newer dashboards; limited workflow depth; not built to diagnose your own visibility swings beyond broad market context; fewer practical segmentation layers than some competing options.
Verdict: MozCast is most useful as a reference signal, not a diagnostic workspace. It earns its place because speed matters when you need to decide whether to investigate internally or wait for broader update patterns to settle.
3. SISTRIX Google Update Radar
SISTRIX is especially useful when volatility needs to be tied back to visibility movement at the domain level. Its update radar and visibility index combination gives you more than a weather score; it helps connect market instability to actual winners and losers. That makes it valuable for competitive analysis during suspected core updates, especially in European markets where SISTRIX has long been deeply used.
Best for: Teams that want to pair update detection with domain-level visibility analysis rather than watch a standalone turbulence meter.
Pros: Strong visibility indexing; practical competitor comparison; useful historical views during update windows; often better for explaining sustained visibility erosion than one-day rank noise; particularly relevant for European SEO monitoring.
Cons: Less of a lightweight “check the weather in 10 seconds” tool; best value comes when you actively use the broader platform; can be more than some smaller teams need if they only want a public volatility signal.
Verdict: Choose SISTRIX when your real question is not “Is Google hot today?” but “Which domains actually gained or lost visibility during this unstable period, and how does that compare to us?”
4. Similarweb SERP Seismometer
Similarweb’s SERP Seismometer is built for reading turbulence as a market event, and its sector view is where it becomes commercially useful. If your rankings are moving in finance, travel, retail, or health, category-level disruption matters more than a generic all-keyword score. This tool is especially useful for teams that need to explain whether an update hit a vertical unevenly.
Best for: Larger brands, publishers, and agencies that need category-specific volatility context and broader market intelligence.
Pros: Vertical-level analysis; useful for identifying sector-specific update pressure; aligns well with broader digital market research; better than generic weather tools when client portfolios span multiple industries with different turbulence profiles.
Cons: Best value depends on using Similarweb more broadly; not the simplest option for small teams seeking a single daily signal; some users will want deeper keyword-level transparency than a market seismometer provides.
Verdict: This is the right choice when update analysis needs to be tied to industry behavior, not just generic SERP heat. It is particularly useful for agencies managing clients in sectors that rarely move in sync.
5. Algoroo
Algoroo has stayed relevant because it shows ranking turbulence in a direct, no-frills format and often gets checked during suspected update windows alongside more established weather tools. Its utility comes from triangulation. Experienced SEOs rarely rely on one dashboard alone, and Algoroo is often part of that stack because it can confirm whether volatility is broad enough to be visible across independent datasets.
Best for: SEOs who cross-check multiple public volatility sources before drawing conclusions.
Pros: Simple interface; easy to compare with other weather tools; useful as a second opinion during turbulent periods; practical for monitoring whether spikes persist over multiple days instead of flashing for one cycle.
Cons: Limited workflow depth; less useful for stakeholder reporting than platforms with richer segmentation; not built to connect turbulence directly to your tracked portfolio.
Verdict: Algoroo works best as corroboration. If two or three independent dashboards are all elevated, you can be more confident that the instability is market-wide rather than a quirk in one provider’s sample.
6. Advanced Web Ranking Google Algorithm Changes
Advanced Web Ranking is valuable because it sits between public weather monitoring and portfolio-specific ranking analysis. Its algorithm change views and ranking data can help teams see whether volatility lines up with actual movement in their own tracked sets. That matters for agencies that need to move from “Google seems unstable” to “Here is the exact keyword segment and landing page group affected.”
Best for: Agencies and in-house teams that want update context tied to ongoing rank tracking and segmented reporting.
Pros: Connects market events with owned keyword data; useful segmentation and reporting; practical for device, location, and search feature analysis; better than standalone weather tools for proving impact to clients or internal stakeholders.
Cons: Less useful if you only want a free public volatility check; setup quality depends on how well your keyword groups are structured; requires active rank tracking discipline to get the full benefit.
Verdict: If your team needs to explain not just that volatility happened but exactly which keyword clusters moved and whether they recovered, AWR is far more actionable than a pure weather chart.
7. RankRanger Rank Risk Index
RankRanger’s Rank Risk Index is useful because it focuses on instability by market and vertical while also living inside a platform built for deeper SERP and rank analysis. That combination makes it practical for teams that care about turbulence but do not want to stop at a public score. The surrounding reporting stack helps connect volatility to universal results, local behavior, and tracked keyword movement.
Best for: SEO teams that want a volatility index plus flexible SERP reporting inside the same environment.
Pros: Industry-level risk tracking; useful integration with rank monitoring; practical SERP feature reporting; suitable for agencies that need recurring update narratives rather than one-off checks.
Cons: Interface depth can feel heavier than lightweight weather tools; best insights require configuration; less immediate for casual users who only want a headline signal.
Verdict: RankRanger is a better fit for operational SEO teams than for casual observers. It pays off when you need to turn volatility into repeatable reporting and segmented diagnosis.
8. Mangools SERPWatcher
Mangools SERPWatcher is not a dedicated public volatility dashboard in the classic weather-tool sense, but it earns a place because many smaller teams care less about market-wide chatter and more about whether their own tracked positions are swinging abnormally. Its performance index and alerting make it useful for spotting instability in a manageable, lower-friction environment.
Best for: Freelancers, small businesses, and lean in-house teams that need practical movement monitoring without enterprise complexity.
Pros: Easier onboarding than heavier suites; clear visibility trends; useful alerts for sudden movement; affordable entry point for teams that need to monitor ranking instability on a defined keyword set.
Cons: Not a true broad-market search weather dashboard; less useful for reading industry-wide update patterns; limited if you need large-scale segmentation across many sites or clients.
Verdict: Choose this when your main concern is “Are our rankings becoming unstable?” rather than “What is the entire Google ecosystem doing today?” It is narrower, but for many smaller operators that is the more commercially relevant question.
9. Ahrefs Rank Tracker
Ahrefs Rank Tracker belongs on this list because SERP turbulence is often best understood through visibility distribution, feature ownership, and competitor share changes on your own keyword universe. Ahrefs does not center the experience around a public weather metaphor, but it gives enough ranking movement, feature tracking, and competitor comparison to identify whether instability is local to your site or part of a wider reshuffle in your niche.
Best for: Teams already using Ahrefs that want to interpret ranking swings through owned and competitor keyword sets rather than rely solely on public volatility indices.
Pros: Useful competitor overlap analysis; SERP feature visibility; historical ranking movement; practical for identifying whether losses came from one competitor, one feature type, or a broader reshuffling across the top 10.
Cons: Not a dedicated market weather dashboard; less immediate for public update pulse checking; some teams will still need an external volatility source for macro context.
Verdict: Ahrefs is most valuable when you need to move from market speculation to query-level evidence. It helps answer whether a drop was caused by broad instability, feature displacement, or a direct competitor gaining ground.
10. SE Ranking
SE Ranking is useful for teams that want ranking instability monitoring with enough reporting structure to support agencies and multi-site operators, but without the cost or complexity of larger enterprise stacks. Its value is operational: segmented keyword groups, scheduled reporting, and visibility changes that can be mapped against suspected update dates.
Best for: Small agencies, mid-market teams, and site owners managing several properties with a need for practical rank volatility reporting.
Pros: Usable reporting workflows; keyword grouping; historical trend analysis; manageable pricing relative to larger platforms; suitable for documenting pre-update and post-update movement across client portfolios.
Cons: Less authority as a public “search weather” reference source; not as specialized in macro volatility signaling as dedicated dashboards; deeper diagnosis still depends on how well campaigns are structured.
Verdict: SE Ranking is a sensible choice if you need to operationalize volatility tracking across accounts and show patterns over time, even if you still pair it with a separate public weather source.
11. Wincher
Wincher is another example of a tool that matters because many ranking swings are internal portfolio events, not global update shocks. Its tracking is straightforward, and that simplicity can be useful when you need to isolate whether a set of core commercial terms is drifting over several days. For smaller teams, that is often more actionable than reading a broad market volatility index with no direct tie to revenue pages.
Best for: Smaller businesses and focused SEO teams tracking a tight keyword set tied to leads or sales.
Pros: Clear rank monitoring; low-friction setup; practical for watching specific money terms during suspected update windows; easier to maintain than more complex enterprise platforms.
Cons: Limited macro search weather context; not designed as a sector-wide turbulence dashboard; less suitable for agencies needing advanced segmentation across many clients and markets.
Verdict: Wincher makes sense when the real business need is protecting a narrow set of high-value rankings. It will not tell you everything about Google’s mood, but it can tell you quickly whether your revenue-driving terms are wobbling.
12. Google Search Console
Google Search Console is not a volatility dashboard in the classic sense, but excluding it would make this list less useful. It is the only source here that shows your actual impressions, clicks, average position patterns, and page-query combinations straight from Google’s own reporting layer. When paired with an external weather tool, it becomes the ground-truth check that tells you whether turbulence is theoretical or materially affecting your search demand and visibility.
Best for: Every site owner, publisher, and SEO team validating whether external volatility signals are reflected in real search performance.
Pros: First-party performance data; page and query filtering; country and device splits; useful for spotting whether losses are impression-driven, CTR-driven, or ranking-driven; essential for confirming whether volatility hit specific templates or content types.
Cons: No market-wide weather score; delayed and sampled reporting limitations in some workflows; average position can mask severe movement on mixed query sets; not suited to competitor or sector-level turbulence analysis by itself.
Verdict: Search Console should be the validation layer behind every volatility workflow. External dashboards tell you when the market is unstable; Search Console tells you whether that instability actually changed your business outcomes.
How to choose and measure success
The right provider depends on the job. If you need a public benchmark to explain sudden movement, use a market weather source such as Semrush Sensor, MozCast, Similarweb, or Algoroo. If you need to diagnose impact on your own portfolio, use a rank tracking platform with segmentation, feature visibility, and competitor comparison. If you need both, pair an external weather dashboard with Search Console and a tracker that groups keywords by intent, template, device, and market.
Measure success by response quality, not by how often you check the chart. A useful setup should reduce false alarms, shorten diagnosis time, and improve stakeholder communication during unstable periods. Track whether your team can answer these questions within one reporting cycle: Was the movement market-wide or site-specific? Which keyword clusters were most affected? Did SERP features change? Which competitors gained? Did traffic and conversions move in line with rankings, or was the shift mostly cosmetic?
For agencies, the best indicator is fewer reactive client escalations and faster delivery of evidence-backed explanations. For publishers, it is quicker identification of affected sections and clearer distinction between temporary turbulence and structural visibility loss. For ecommerce teams, it is knowing whether category and product terms moved because of shopping feature churn, local intent shifts, or broader organic reordering.
FAQ
What is a SERP volatility dashboard?
It is a tool or index that measures how much Google search results are shifting over time. Some focus on broad market turbulence across a large keyword sample. Others show instability inside your own tracked keyword set.
Can a volatility spike confirm a Google update?
No. It can indicate unusual movement, but it does not confirm the cause. You still need to compare multiple data sources, review affected query groups, and check your own performance data before attributing changes to a confirmed update.
Should you rely on one dashboard?
No. Different providers use different keyword sets, geographies, devices, and sampling methods. Cross-checking two or three sources reduces the risk of misreading a spike that is limited to one dataset.
What is the best setup for agencies?
A practical agency stack is one public market weather source, one rank tracking platform with segmented reporting, and Google Search Console for validation. That combination lets you explain broad turbulence and prove client-specific impact.
How often should you check search weather?
Daily is enough for most teams, with closer monitoring during suspected update windows or after major site changes. Hourly checking usually creates noise unless you are managing a highly sensitive news or ecommerce environment.